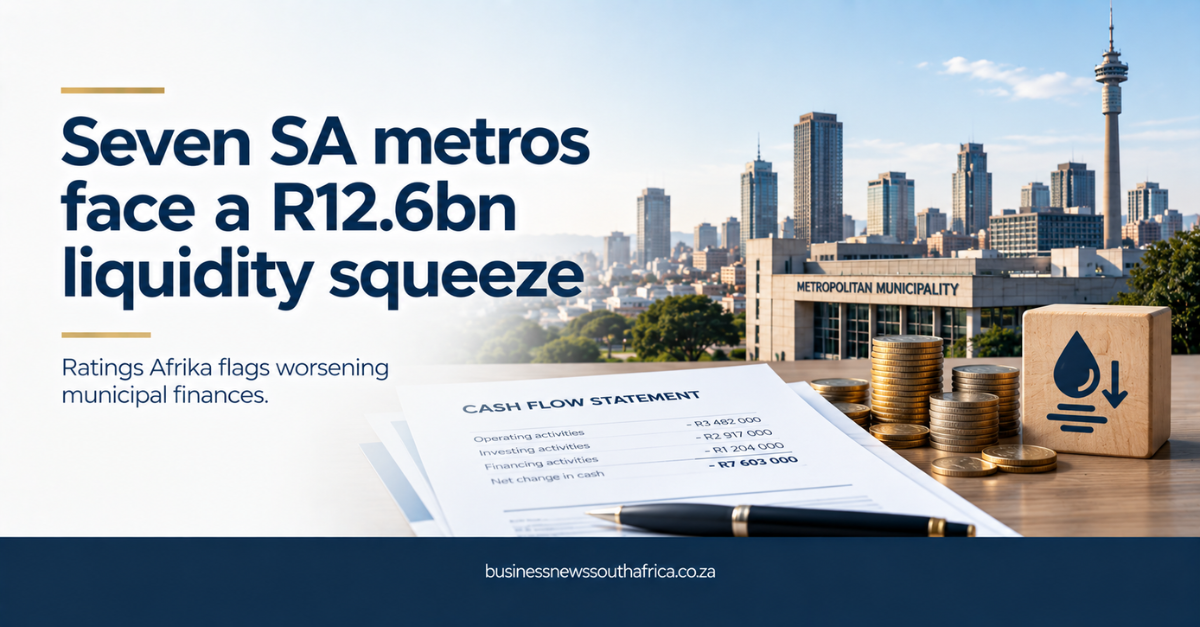
In the boardrooms of South Africa’s metropolitan municipalities, the mood is grim. A new analysis from Ratings Afrika, published on Moneyweb, flags liquidity shortfalls totalling almost R12.6 billion across seven of the eight metros for 2025.
The only outlier is Cape Town, which posted an operating surplus of R2.9 billion and kept its borrowing to roughly 12 % of operating revenue. All other metros spent more than they earned, leaving cash gaps that threaten service delivery and could force higher rates for businesses and households.
What the Municipal Financial Sustainability Index measures
The Municipal Financial Sustainability Index (MFSI) scores each metro out of 100 using audited financial statements. It looks at six pillars: operating performance, liquidity management, debt governance, budget practices, affordability and infrastructure development. A higher score signals a healthier balance sheet and better capacity to fund services without resorting to emergency borrowing.
Across the eight metros, the average MFSI score slipped to just under 40. Cape Town leads with 71, followed by Nelson Mandela Bay at 48 and Buffalo City at 43. The remaining five metros sit below 30, indicating severe fiscal stress.
Johannesburg, the country’s largest economy, paints the bleakest picture. Four consecutive years of operating losses have carved a hole of R10.1 billion in liquidity by 2025, down from a surplus of R2.6 billion in 2021. Its revenue collection rate, the percentage of invoices actually collected, is only 84.4 %, well below the 95 % benchmark that most fiscally disciplined municipalities aim for. To keep the lights on, the city has leaned heavily on borrowing, with total debt rising to R22.9 billion, equivalent to more than 34 % of its operating revenue.
Tshwane ranks lowest on the index with a score of 25. A liquidity shortfall of R8.4 billion and a revenue collection rate of 88 % have forced the metro to consider rate hikes, a move that could make basic services unaffordable for many residents. Its capital expenditure of just R1.5 billion in 2025 earned an infrastructure development score of 16, highlighting a chronic under-investment in roads, water and sanitation.
Nelson Mandela Bay shows a mixed bag. An operating loss of R1 billion in 2025 marks an improvement on the previous year, but a revenue collection rate of only 71 % threatens its ability to maintain service delivery. Long-term borrowings remain low at R800 million, or 5.3 % of operating revenue, keeping debt risk modest for now.
Ekurhuleni’s MFSI score of 31 reflects five straight years of operating deficits. Its infrastructure development component fell from 62 in 2021 to 40 in 2025, signalling a slowdown in projects that support a fast-growing population.
Mangaung, long regarded as one of the most mis-managed metros, continues to grapple with operating losses driven by weak budgeting and poor financial discipline. Deferred maintenance and limited capital spending have eroded the city’s service quality.
For small and medium-sized enterprises, the municipal crunch translates into higher rates, delayed permits and the risk of service interruptions. Companies that rely on reliable water, electricity and road networks may see operating costs rise as metros scramble to raise revenue.
“The City of Gold has unfortunately lost much of its shine,” says Leon Claassen, managing executive at Ratings Afrika. “Restoring Johannesburg to its former economic and urban stature will require an extraordinary and sustained effort. Above all, this will depend on rebuilding the city’s financial sustainability, strengthening governance and ensuring that available resources are used efficiently to restore service delivery and support long-term infrastructure investment.”
Municipal leaders face a choice: tighten fiscal discipline, improve revenue collection and protect essential services, or risk a deeper crisis that could spill over into the broader economy. For businesses watching municipal budgets, tools like the commercial funding suite can help model the impact of higher rates and delayed projects on cash flow.
Read more about municipal finance trends in the Markets & Finance section.