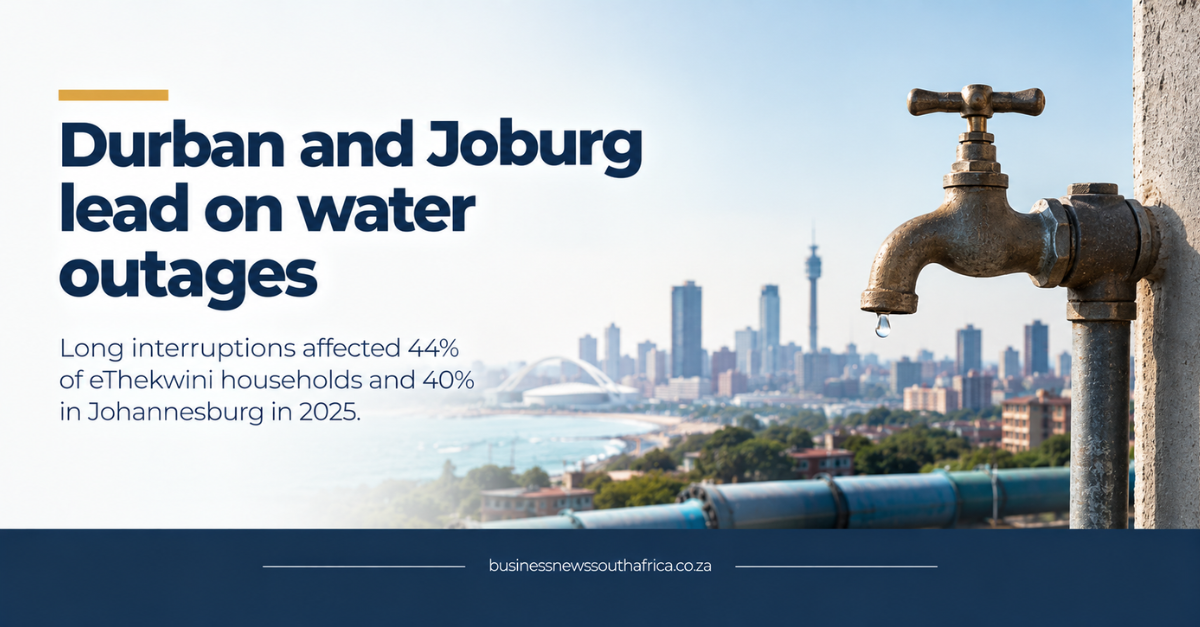
According to a Moneyweb report, eThekwini (Durban) and Johannesburg recorded the longest water outages among South Africa’s metros in 2025, with 44% and 40% of households respectively experiencing cuts of two days or more.
The national household survey by Stats SA shows that 76% of South Africans now have a tap inside their home or on their property, but more than a third of all households suffered prolonged outages. The eight metros performed slightly better than the national average, with 30% of households reporting long cuts. Cape Town fared best at 8%, while eThekwini and Johannesburg were the worst.
The report attributes the problem mainly to old, poorly maintained pipes that leak and burst. In water-utility terms, this is called non-revenue water, water that is lost before it can be billed. In eThekwini, the Auditor-General estimates that 61% of water is lost to leaks, illegal connections or non-billing. By contrast, the Department of Water and Sanitation puts the loss in Cape Town at about 25%.
Financially, the impact is huge. The latest review by National Treasury found that the metros together lost nearly R8.7 billion worth of water in the 2023/24 financial year. Nationwide, the share of water lost or never paid for rose from 37% in 2014 to 47% in 2023, according to the No Drop report. The international average sits around 30%.
Why the outages matter for businesses
For small and medium enterprises that rely on water, from restaurants and laundries to manufacturing units, a two-day cut can halt production, force staff to work from home or require costly temporary water supplies. The added expense of bottled water, generators for pump stations or extra staffing for manual cleaning erodes profit margins. In a tight credit environment, these unexpected costs can strain cash flow and limit growth plans.
Prolonged outages also affect customer experience. A bakery that cannot bake bread or a car wash that cannot operate loses revenue and risks losing regular clients to competitors with more reliable water access. The cumulative effect across thousands of SMEs can feed into higher inflation for water-intensive goods.
Addressing the issue will require substantial investment in pipe replacement, leak detection technology and better billing systems. The current loss rates are well above the global benchmark, suggesting that incremental fixes will not be enough. While the report does not detail any specific funding programme, municipal budgets will need to allocate more resources to infrastructure, and the private sector may be called upon for partnership or financing.
What remains unclear is the timeline for large-scale upgrades and the exact amount of capital that will be mobilised. Until the pipe networks are modernised, businesses in the hardest-hit metros will have to continue planning for water disruptions as a regular operational risk.
For more analysis on how municipal water challenges intersect with regulatory policy, see our Regulatory & Policy coverage.
Nelson Mandela Bay, with 38% of households reporting two-day outages, sits just behind Johannesburg in the rankings, while Buffalo City and Tshwane record 33% and 31% respectively, according to the General Household Survey. Mangaung’s figure stands at 24% and Ekurhuleni at 22%, illustrating a clear gradient of vulnerability across the eight metros. These percentages are notably higher than Cape Town’s 8%, reinforcing the link between pipe condition and outage frequency. The data also show that, despite the national tap-in-home rate of 76%, a substantial share of residents still endure prolonged disruptions, highlighting the uneven distribution of service reliability.
Beyond ageing infrastructure, the Outlier-GroundUp analysis points to bulk water supply constraints, pressure-management failures and delayed repairs as secondary drivers of outages. When dams release insufficient volumes, downstream municipalities must ration flow, which can exacerbate pressure drops and increase the likelihood of pipe bursts. Ineffective pressure regulation can cause intermittent surges that stress joints, while slow response times to reported leaks allow small fissures to expand into major breaks. These operational shortcomings compound the physical deterioration of networks, creating a feedback loop that magnifies water loss and service interruptions.
The audit process for non-revenue water begins with a comprehensive metering audit, comparing bulk water input against billed consumption to isolate losses. Once the gap is quantified, utilities conduct pipe-condition surveys using acoustic sensors and smart-meter data to pinpoint leak hotspots. Repairs are then prioritised based on severity, impact on customers and cost-effectiveness. Following remediation, billing systems are updated to capture previously unrecorded usage, and regular monitoring ensures that the loss ratio does not revert to previous levels. This cycle repeats annually, feeding data into Treasury’s financial reviews.
National Treasury’s latest review, which identified nearly R8.7 billion in lost water value for the 2023/24 fiscal year, will feed into the upcoming municipal budgeting cycle. The No Drop report’s rise to 47% non-revenue water in 2023 signals that future allocations must address both physical pipe replacement and the ancillary systems that manage flow and billing. As municipalities prepare their next financial statements, they will be required to disclose projected investment in leak detection, pressure-control upgrades and accelerated repair programmes, setting the stage for targeted spending in the next fiscal period.