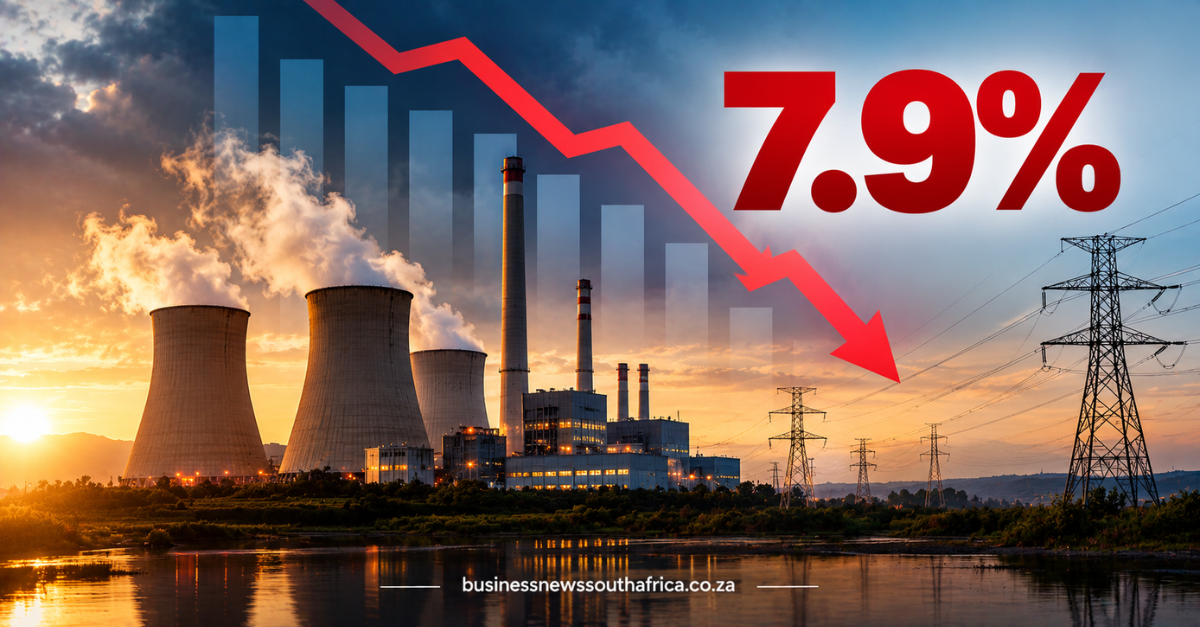
On a typical weekday in July, the hum of turbines at power stations fell noticeably quieter. According to Stats SA, total electricity generation in South Africa slipped by 7.9% in July 2026 compared with the previous month.
Electricity generation is the amount of power that the national grid produces, measured in gigawatt-hours (GWh). A decline of this size means less electricity is available for factories, retail outlets, farms and offices that depend on a reliable supply to keep the lights on and machines running.
The drop comes at a time when many small and medium enterprises (SMEs) are already feeling the squeeze from high energy costs and intermittent load-shedding. For a manufacturing firm that runs 24-hour shifts, a 7.9% reduction in available power can translate into lost output, overtime pay for staff covering slower production, or even the need to purchase expensive diesel generators as a backup.
Why the dip matters for business
South Africa’s power sector is dominated by Eskom, the state-owned utility that supplies roughly 95% of the country’s electricity. Eskom has been grappling with ageing infrastructure, fuel supply constraints and financial stress for several years. When generation falls, the utility typically raises the load-shedding stage, a schedule that tells municipalities how many areas must be turned off temporarily to keep the grid stable.
For SMEs, each step up in load-shedding can mean a loss of up to several hours of production per day. A study by the Department of Trade, Industry and Competition earlier this year estimated that load-shedding costs the economy around R10 billion per month in lost output. While the exact figure for July is not yet published, the 7.9% fall in generation suggests that businesses may have faced a similar or higher hit.
Beyond the immediate operational impact, the decline also affects financing. Banks and investors look at a company’s ability to meet its debt obligations, and unreliable power can increase the risk of missed payments. In the SME sector, where cash flow is already tight, an extra expense for backup power or a slowdown in sales can tip the balance.
What the numbers say
Stats SA’s release does not break down the cause of the dip, but historical patterns point to a combination of scheduled maintenance, unexpected plant outages and lower water levels at hydro-electric stations. The agency also tracks renewable output, which has been growing but still represents a small share of the total mix.
In July 2025, the same agency recorded a 3.2% rise in generation, showing how volatile the supply side can be from one year to the next. The current 7.9% fall therefore represents a reversal of that modest growth.
What businesses can do now
SMEs facing tighter power supplies can take a few practical steps. First, review energy contracts to see if there are clauses that allow for renegotiation when load-shedding exceeds a certain threshold. Second, explore short-term financing options that specifically cover energy costs; the commercial funding suite tool can help identify suitable products.
Finally, consider investing in energy-efficiency measures such as LED lighting, variable-speed drives for motors and better insulation. While these upgrades require upfront capital, they can reduce the amount of electricity needed when the grid is constrained, lowering both the risk of production loss and the overall energy bill.
Until the next Stats SA release clarifies whether July’s dip was an outlier or the start of a broader trend, businesses will need to keep a close eye on power-related metrics and plan for the possibility of further reductions in generation.
A year-on-year drop in electricity generation of this scale can reflect either genuinely reduced demand, itself sometimes a sign of broader economic weakness as industrial and mining users cut output, or supply-side constraints such as planned maintenance and unplanned breakdowns at Eskom’s own generating units, with the two explanations carrying very different implications for the economy depending on which is the dominant driver in a given month. Stats SA’s own manufacturing and mining production data, released on a similar monthly cycle, is typically read alongside generation figures like this one to help distinguish a demand-side slowdown from a supply-side constraint. Statistics South Africa’s own electricity generation and consumption releases provide the detailed monthly breakdown behind a headline figure like this one. For related coverage, see this site’s Energy and Infrastructure coverage.