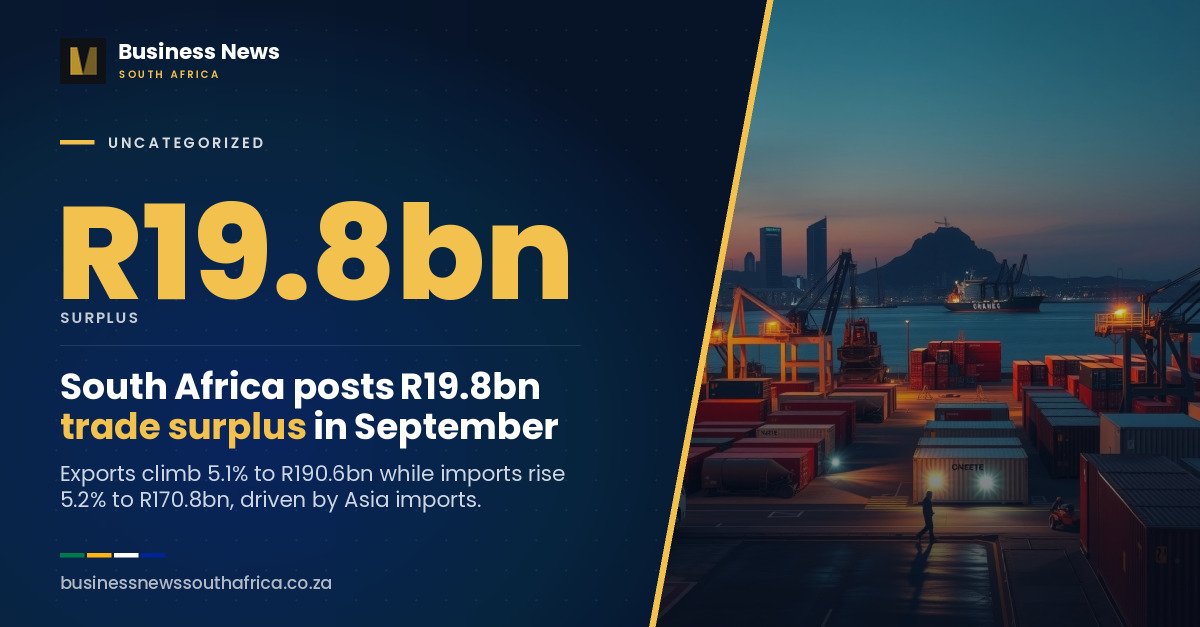
South Africa recorded a preliminary trade surplus of R19.8 billion in September 2026, according to the trade statistics release published by the South African Revenue Service (SARS) on 30 October. Exports came to R190.6 billion and imports to R170.8 billion, figures that include trade with Botswana, Eswatini, Lesotho and Namibia (BELN). Both exports and imports grew from August.
The headline numbers
The R19.8 billion surplus is preliminary. SARS says that because of ongoing Vouchers of Correction, the R20.5 billion surplus first announced for August was revised down by R1.5 billion, to a final R19.0 billion. September’s figure can be revised in the same way once corrections are processed, so treat it as a first reading rather than a settled number.
From August to September, exports rose by R9.3 billion (5.1%), from R181.3 billion to R190.6 billion. Imports rose by R8.4 billion (5.2%), from R162.3 billion to R170.8 billion.
Compared with September 2025, exports were 2.2% higher (R190.6 billion against R186.4 billion) and imports were 3.6% higher (R170.8 billion against R164.9 billion). Imports are growing faster than exports over the year.
For the year to date, covering 1 January to 30 September 2026, SARS reports a preliminary surplus of R169.0 billion, against R117.5 billion for the same period of 2025. Year-to-date exports were about R1.6 trillion and imports about R1.5 trillion.
What drove the month
SARS attributes the rise in exports to higher shipments of platinum group metals (PGMs), gold, and zinc ores and concentrates. Imports rose on the back of higher purchases of petroleum oils (excluding crude), aeroplanes, and automatic data processing machines, which is the customs description for computers and similar equipment.
For a business, the mix matters more than the total. A surplus built on mineral and metal exports says little about manufacturers or farmers, and imported fuel and computers feed straight into transport and technology costs.
Where the trade went
The release breaks trade down by world zone, with BELN included. The month-on-month movements between August (revised) and September (preliminary) were as follows.
- Africa: exports of R49.5 billion (up 3.6%) against imports of R20.0 billion (up 4.5%), a surplus of R29.6 billion. This is the largest surplus of any zone.
- Asia: exports of R57.7 billion (up 5.0%) against imports of R95.6 billion (up 17.8%), a deficit of R37.9 billion, up from R26.2 billion in August.
- Europe: exports of R46.0 billion (up 9.9%) against imports of R36.9 billion (down 18.0%), a surplus of R9.0 billion, compared with a R3.2 billion deficit in August.
- America: exports of R15.8 billion (down 11.6%) against imports of R16.0 billion (up 2.3%), a small deficit of R237 million.
- Oceania: exports of R1.7 billion (down 28.7%) against imports of R2.0 billion (up 130.7%), a deficit of R284 million.
The Asian import jump is the single biggest swing in the table. Asia supplied R95.6 billion of imports in September, which is more than half of the R170.8 billion total. Anyone sourcing from Asian suppliers is exposed to that flow.
Excluding the neighbours
SARS also publishes the figures without BELN. South Africa’s trade with the rest of the world produced a surplus of R8.7 billion in September, from exports of R173.0 billion and imports of R164.2 billion. The cumulative surplus on this basis is R78.0 billion, against R25.6 billion a year earlier.
Trade with the four BELN countries alone produced a September surplus of R11.1 billion, from exports of R17.6 billion and imports of R6.5 billion. The year-to-date surplus with those neighbours is R91.0 billion, slightly lower than the R91.9 billion recorded at this point in 2025. The year-on-year improvement therefore comes from trade with the rest of the world.
What it means for a business
- Importers: a rising import bill, led by fuel, aircraft and computers, is a reminder to check supplier contracts, landed-cost calculations and customs paperwork. Our guide to importing goods into South Africa sets out registration, duty, VAT and permits.
- Exporters: growth in exports to Africa and Europe was strong in the month, while shipments to the Americas and Oceania fell. Exposure to a single market remains a risk, as the cost of US tariffs to Western Cape exporters showed.
- Manufacturers: factory sentiment remains weak, as our report on the Absa PMI shows, while vehicle exports recovered, as the October vehicle sales and exports data showed.
What is not yet known
The figures are preliminary and, as August showed, can move by more than R1 billion in revision. The release does not say how much of the export growth reflects higher volumes and how much reflects higher prices, so the underlying drivers cannot be separated from the data alone. SARS publishes these figures monthly, and the October release will show whether September’s rise in both exports and imports was a one-month swing or the start of a trend.
The full release and detailed tables are on the SARS trade statistics page, and SARS invites queries at TradeStatistics@sars.gov.za.